Measure
STDF Analytics
Production data is the ground truth of a test program, and it arrives as STDF V4 binaries nobody wants to open by hand. ATE·IQ parses them natively on the engineer's machine — yield, bins, Cpk, drift, wafer maps, outlier screens — and feeds the statistics back toward the program as proposals, never silent edits.
Overview
Native STDF V4 parsing, no external dependency. Files arrive as .std or
.std.gz, by direct upload or from a synced repository, and parse
locally.
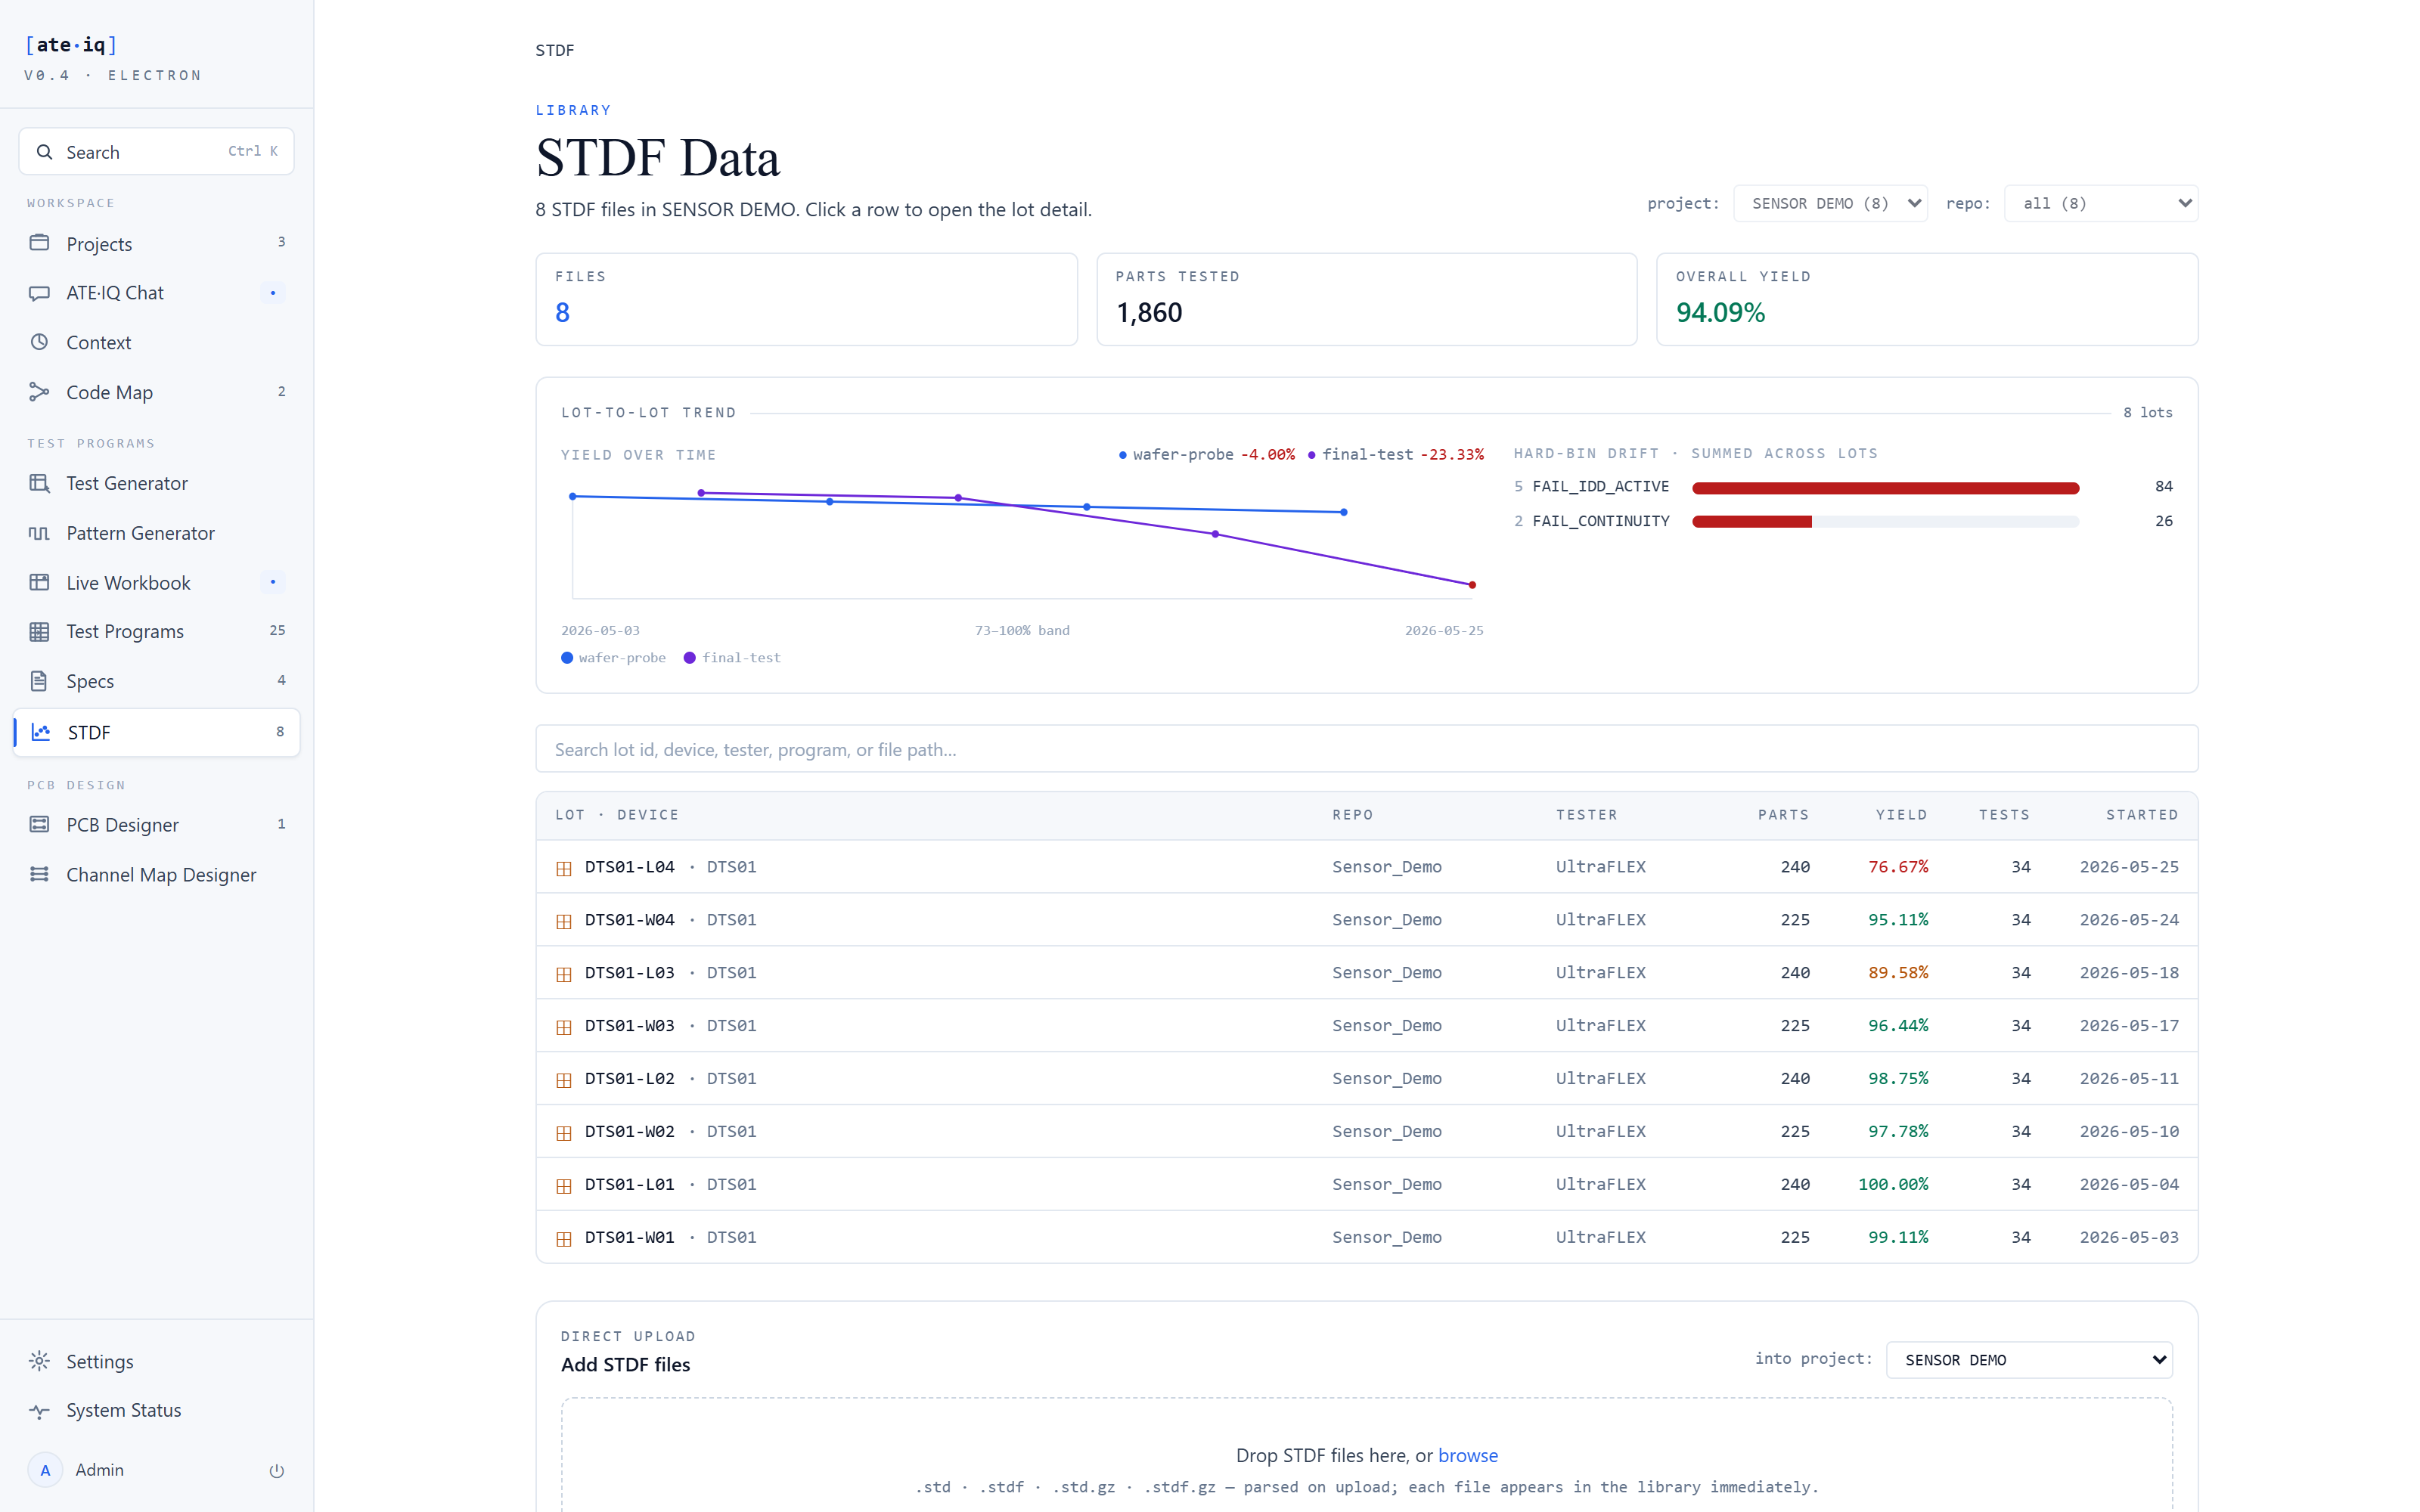
The library page is not just a file list. It carries a lot-to-lot yield trend and a hard-bin drift strip summed across lots, so a program that is slowly losing yield is visible before anyone opens a single lot.
The analysis tools
Every analysis is deterministic — same inputs, same answer — and every surface that shows a number shows the same one: the STDF pages, the traceability dashboard's production hop and the chat assistant cannot disagree.
| Tool | What it computes |
|---|---|
| Lot summary | Lot, device, tester and program identity plus part count and yield, from the MIR and PCR records. |
| Yield summary | Hard- and soft-bin pareto and overall yield per lot. |
| Parametric statistics | Per-test mean, standard deviation, Cp and Cpk — from PTR and MPR records. Multi-pin parametric results are folded in, not silently excluded, so MPR-heavy programs do not show an empty grid. |
| Correlation | Cross-file trend for a single test across lots, plus first-fail and test-time paretos and a wafer map. |
| Outlier screen | Dynamic-PAT robust limits derived from the population itself. Flags parts that pass program limits but sit outside the population. Below 30 samples it reports insufficient data — never a fake "0 outliers". |
| Functional fails | Fail table from FTR records for pattern-based tests. |
| Limit drift | Reconciles a lot against the spec and program limits mechanically — the limits a lot actually ran versus the limits the program has now. |
Lot detail
Opening a lot gives the working view a product engineer reaches for first: per-site yield, the hard-bin pareto, the top failing tests with their Cpk, and a limit-drift table that reconciles what the lot ran against the spec and the program.
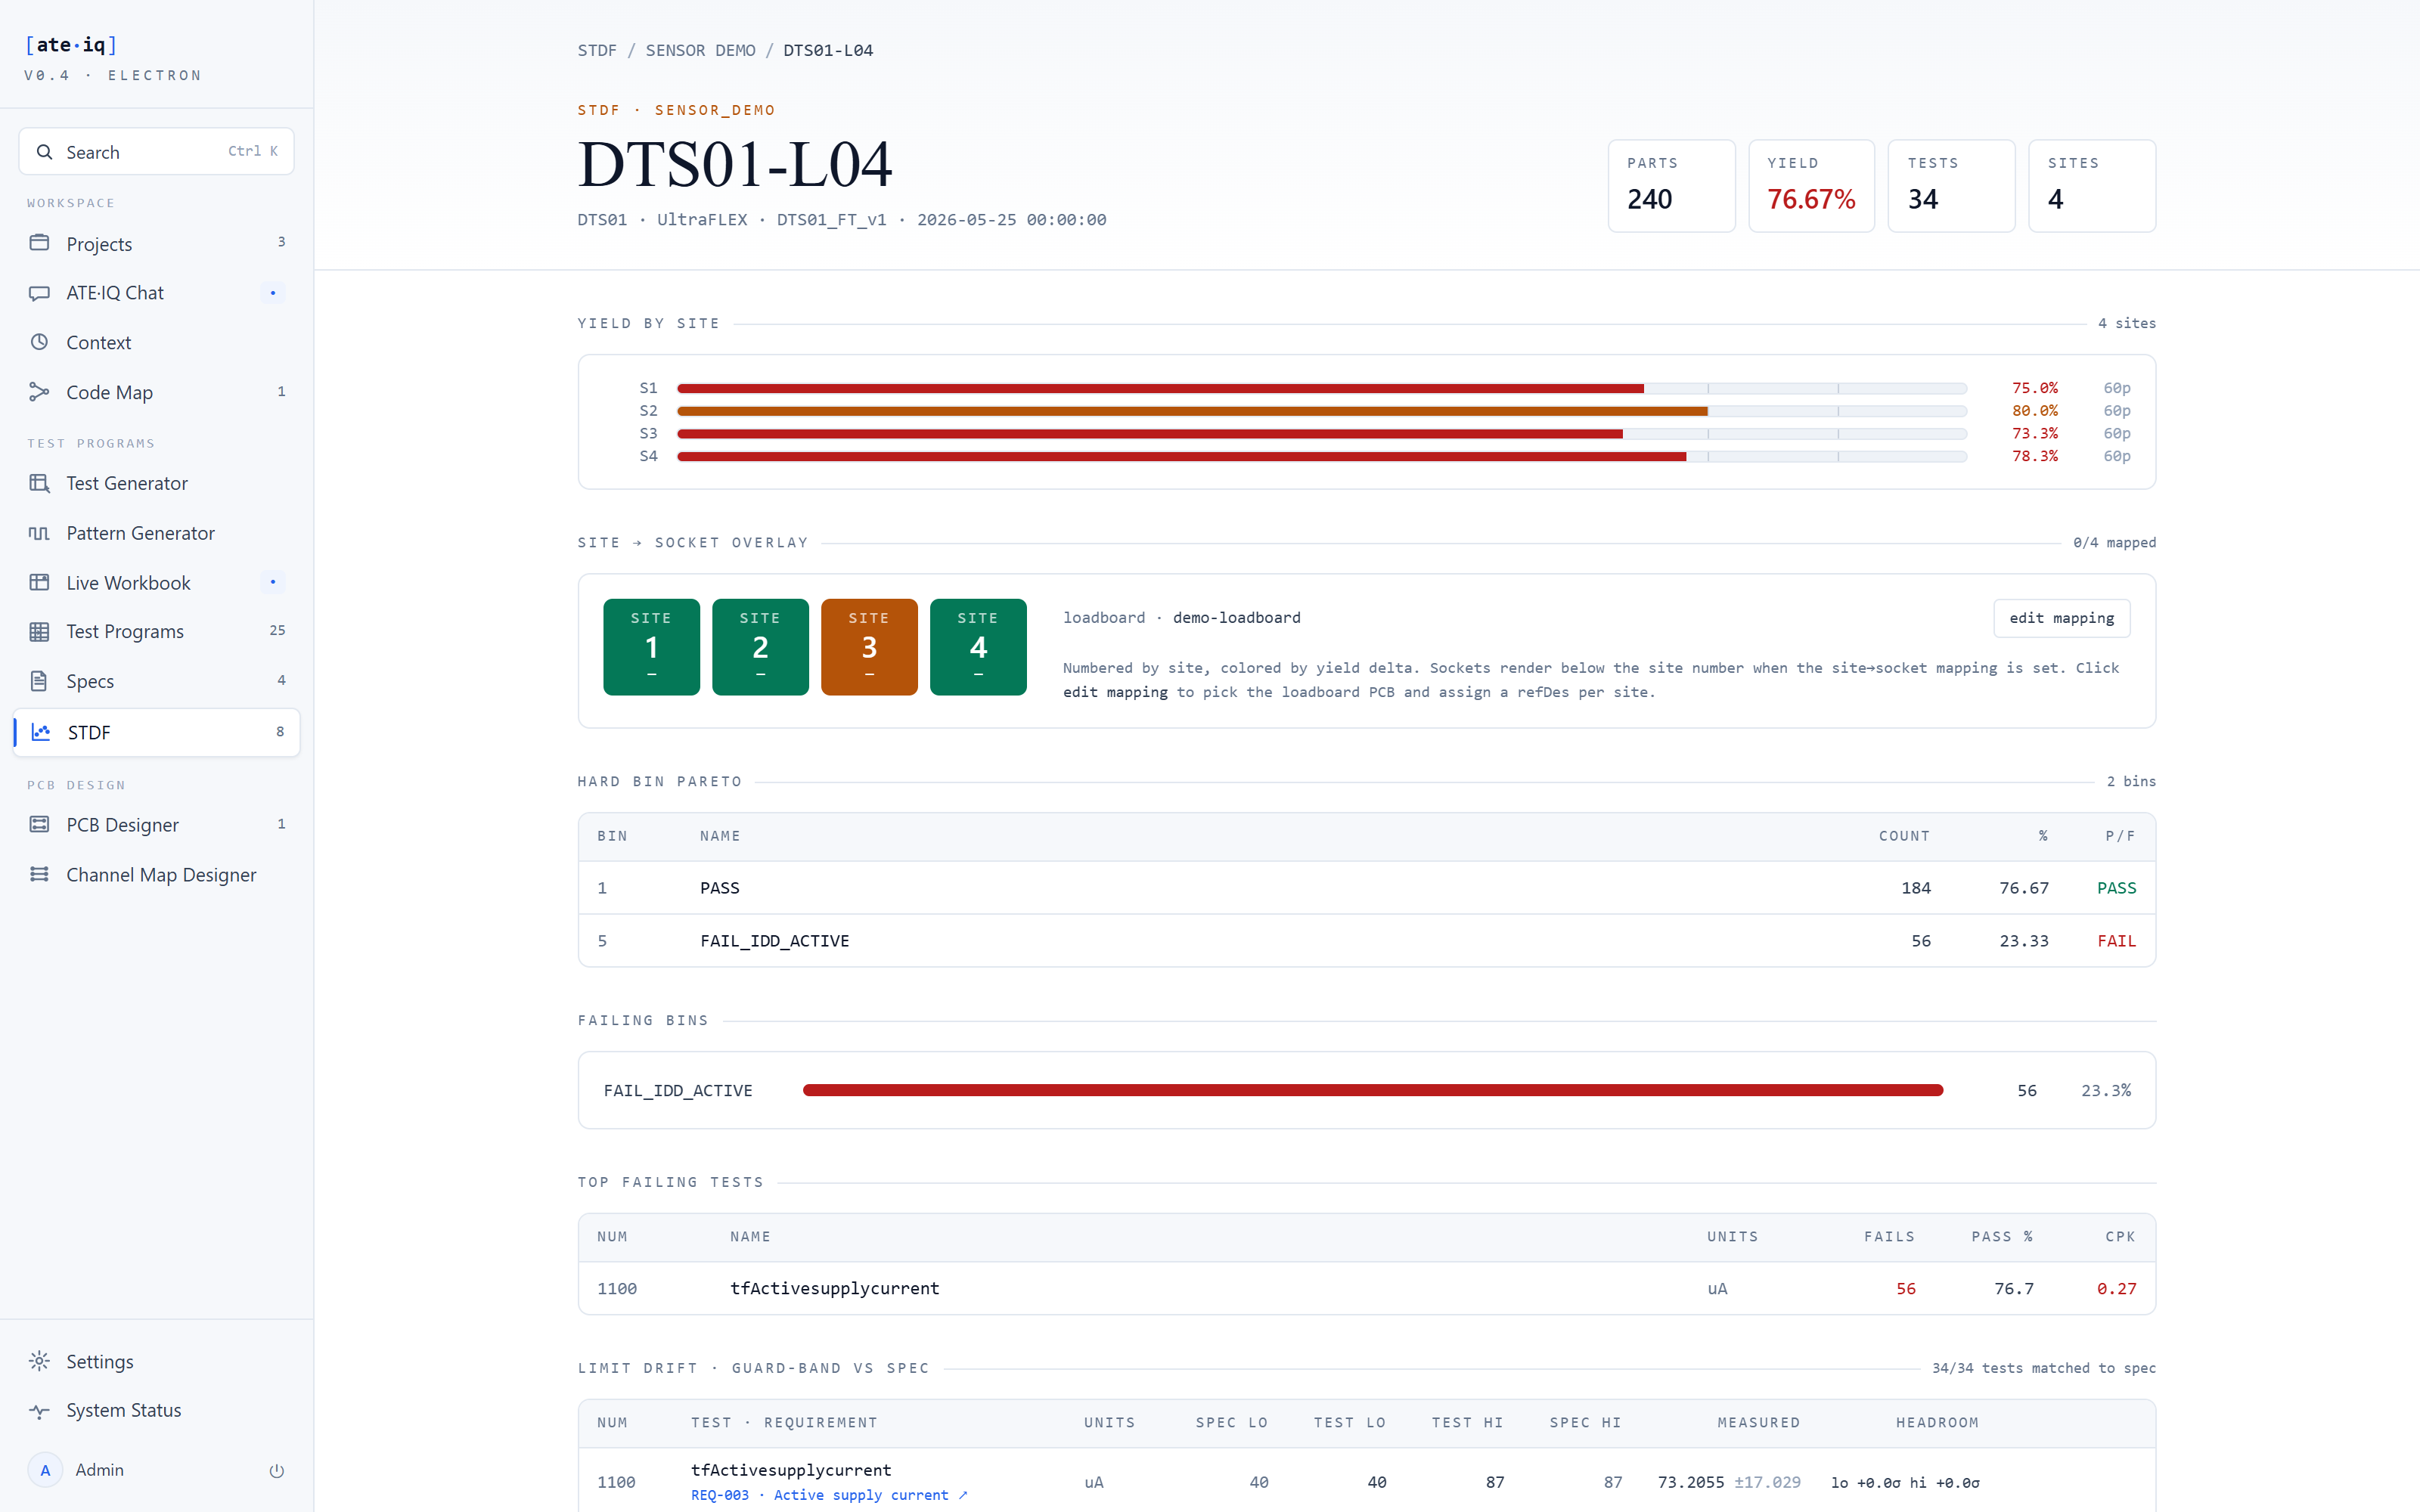
The site↔socket overlay maps each test site to a load-board socket, so a per-site yield skew can be read against the physical board rather than an abstract site number.
Wafer maps
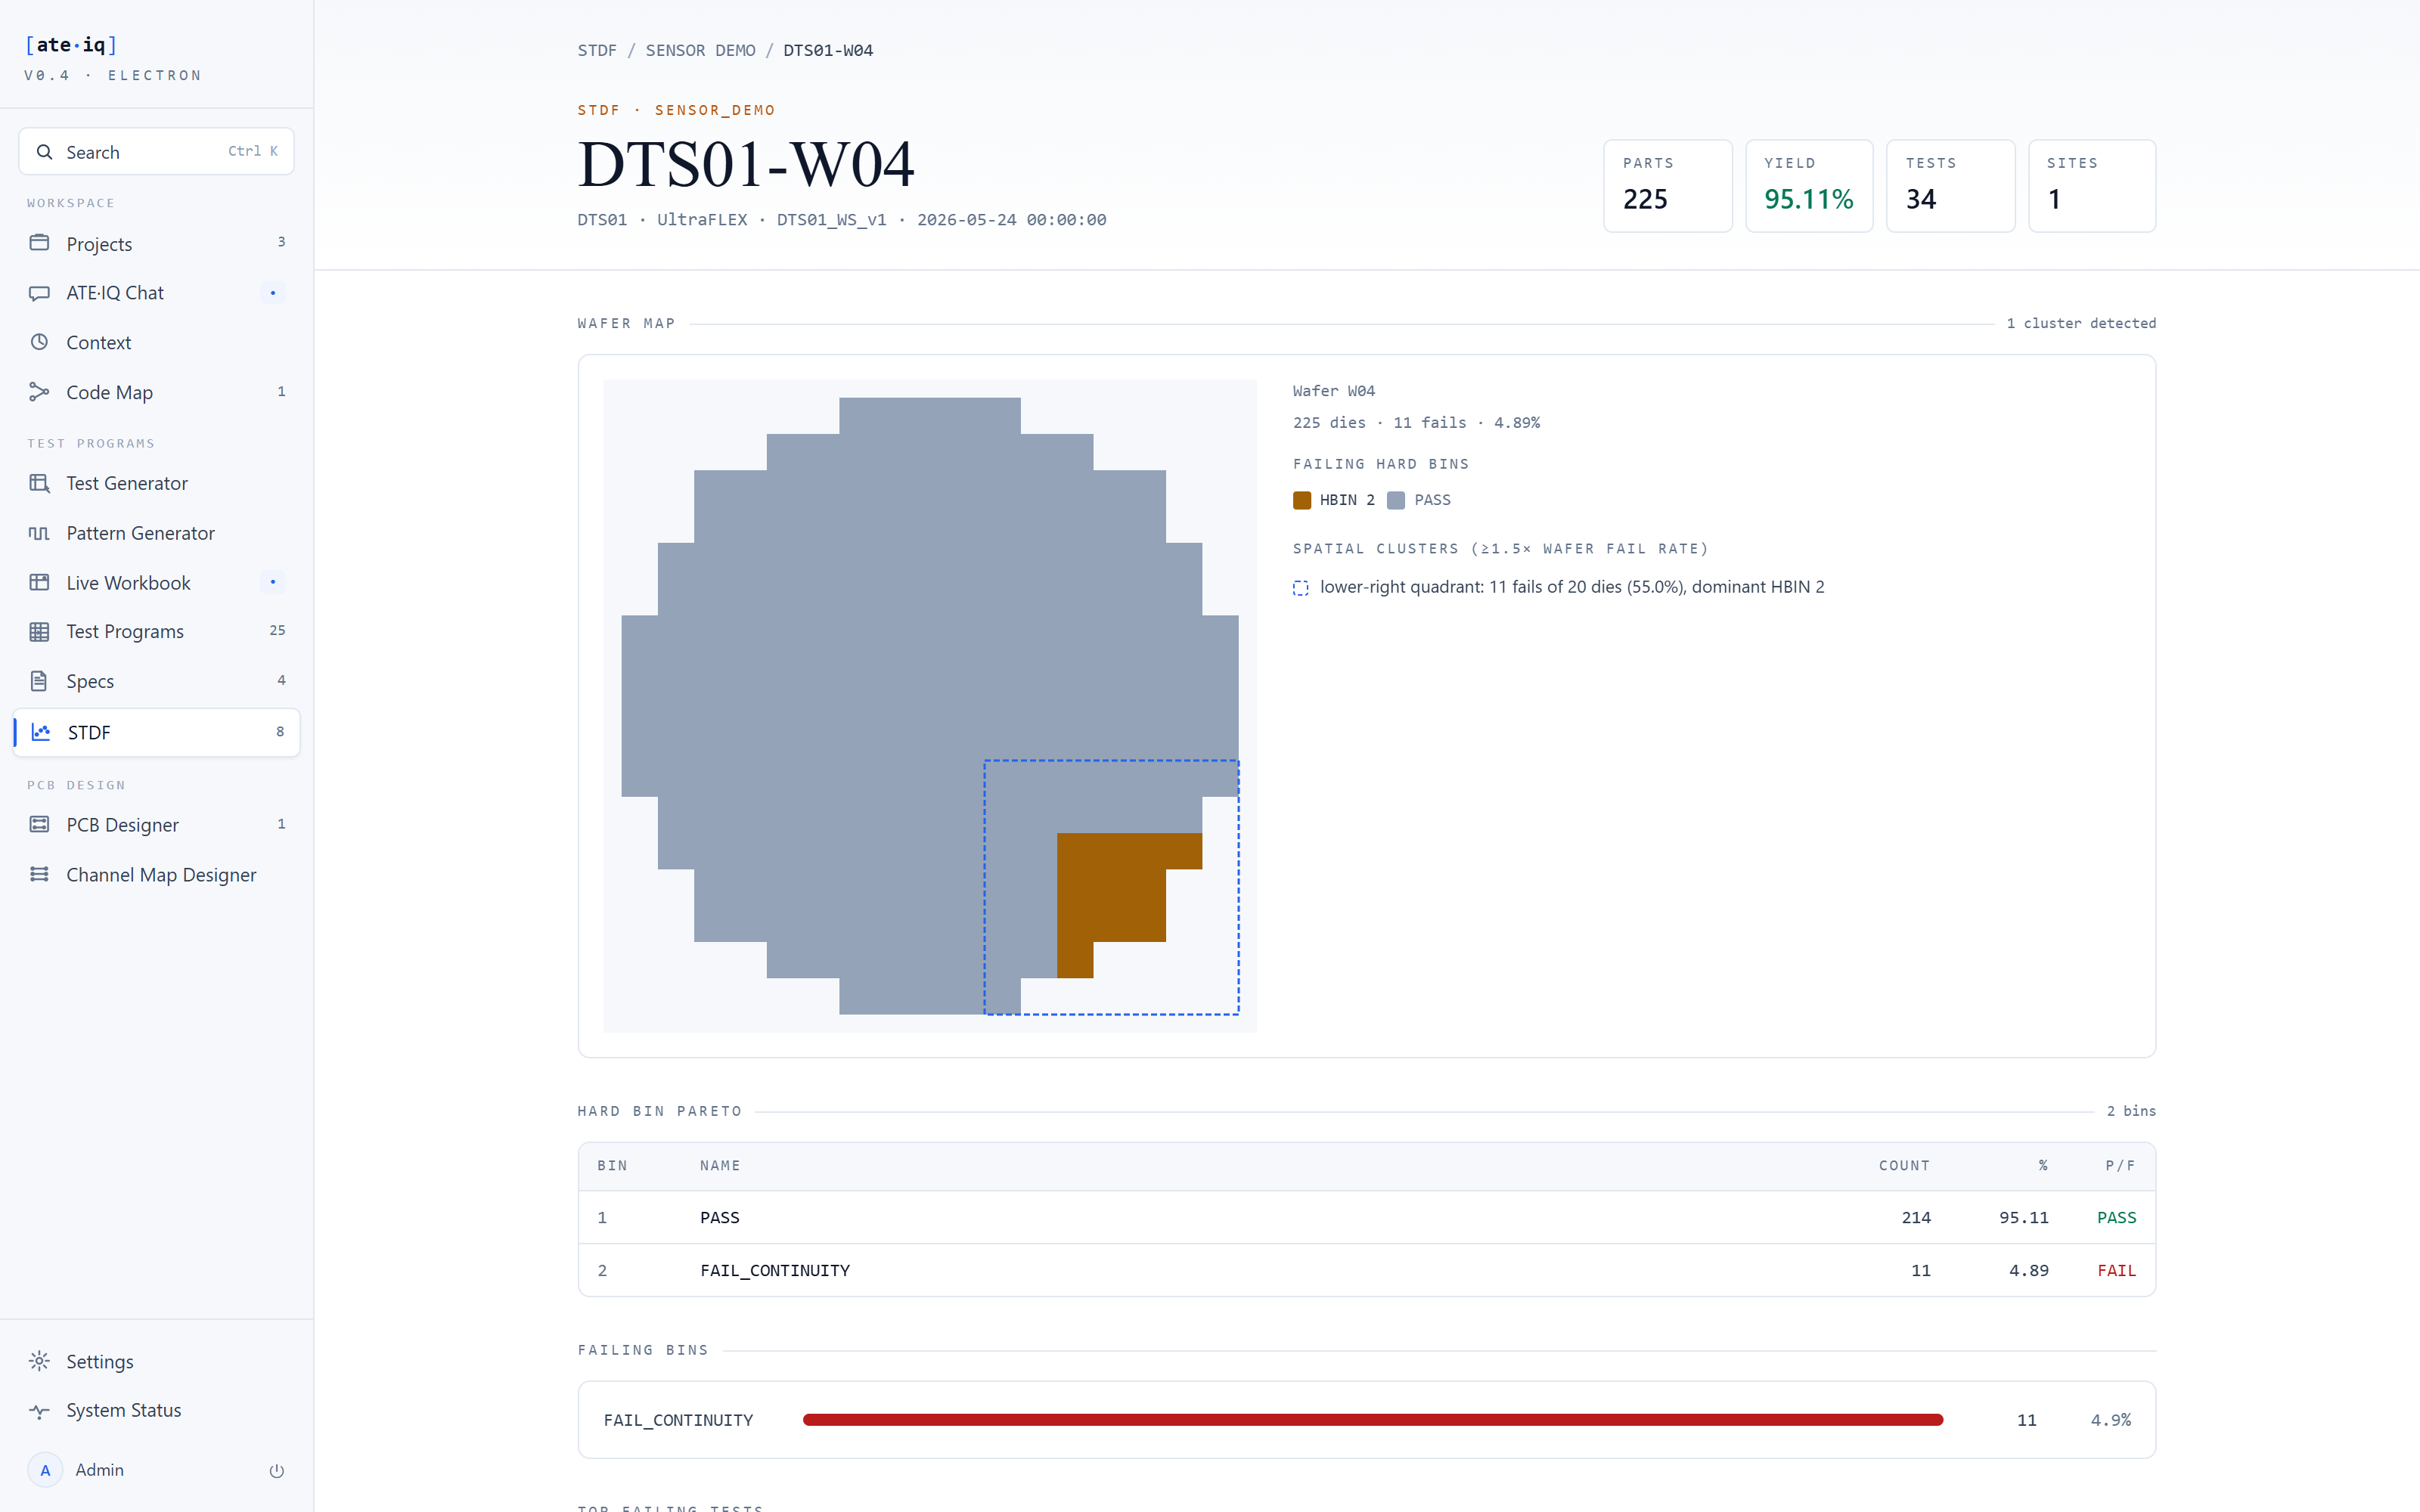
Wafer-sort lots render as a die map with spatial-cluster detection. Spatial fail clusters are detected and named with their dominant bin — the difference between a random defect level and a process or probe-card signature.
Feeding statistics back to the program
The loop does not stop at detection. The limit-proposal tool turns lot statistics into a proposed program limit pair — deterministically, with zero LLM calls: proposals derived from the lot's statistics, clipped to the spec, and classified — presented for review, never applied. A population that itself sits outside spec is flagged as an engineering problem, not papered over as a limits change. And it stays a proposal the engineer applies through the Limits sheet: the tool has no write path to the program, by design.
The proposal also reports which copy of the program its current limits came from — the live open workbook or an ingested snapshot — every claim carries its source, here and on the traceability dashboard.
Proven end to end
The demonstration project carries eight lots — four wafer-sort, four final-test — as genuine STDF V4 binaries read by the same parser a production file goes through, though the lots are synthesised for the demonstration, not silicon data, and the platform does not present them as a production result. Wafer sort stays healthy — 95.11% on the last wafer, with one continuity cluster disclosed rather than averaged away — while final test drifts: test 1100 (active supply current) degrades from Cpk 1.05 to 0.27 across four lots, taking the final-test lot to 76.67% yield with 56 parts in a single fail bin, and because the lot is joined to the load board, the analysis hub names the board-side debug suspects for that test: U1, R2 and R9.
.std.Z (LZW compression) is intentionally rejected with a clear
error — decompress externally to
.std first. And statistics computed under an earlier version are
never silently recomputed — re-ingest the file to refresh them.