Navigate
Code Map
A dependency map over everything a test program is made of — VBA modules,
.atp digital patterns, IG-XL sheets, C/C++ and Python — with the two
joins an ATE engineer actually needs: which tests run this pattern,
and which active procedures have an implementation. Quality findings
overlay the same table.
Overview
Every synced repository is indexed into a file table: language, imports, exports, and the content itself. Select a file and the side panel shows what it depends on, what uses it, and what it exports — plus any quality findings on that file.
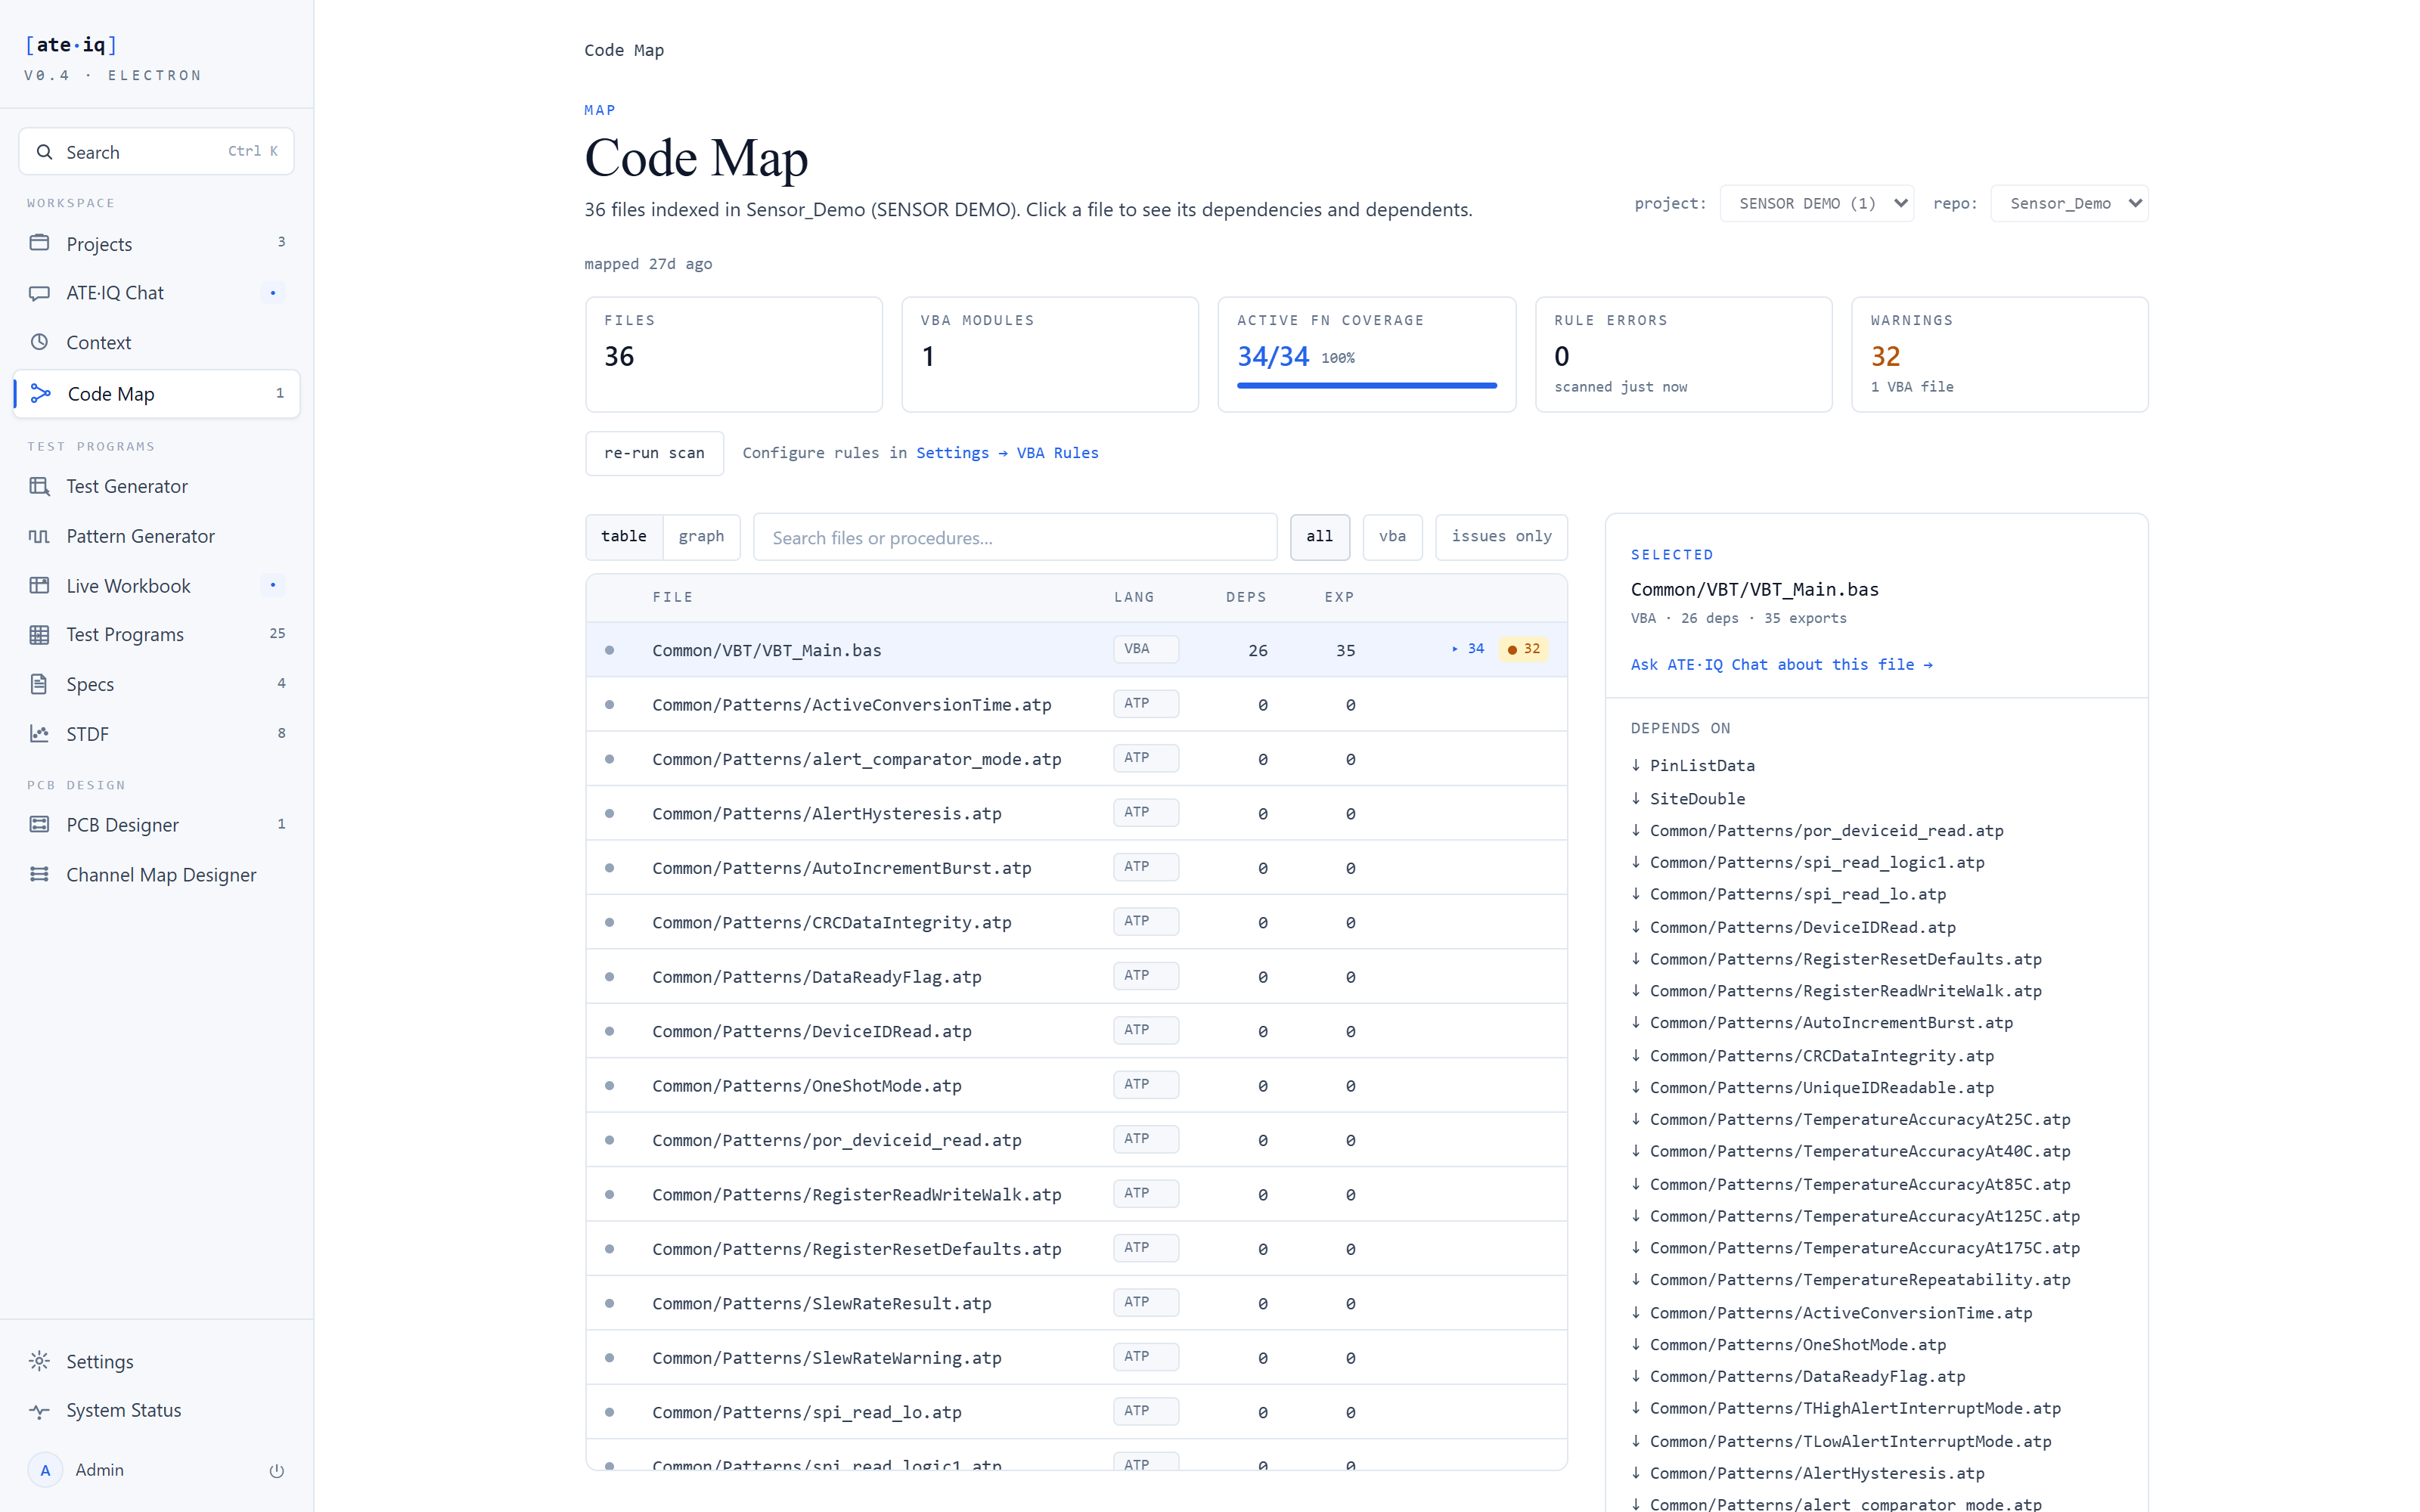
VBT_Main.bas selected — 26 dependencies, 35 exported procedures.The map is not a text search. Dependencies are extracted per language, so an edge means the code actually uses the file — not that a name happened to appear somewhere in the text.
What gets mapped
| Artefact | Dependency signal | Why it matters |
|---|---|---|
| VBA modules (.bas / .cls / .frm) | Real calls and references between modules, in every VBA call style. | Which module breaks when you change this one. |
| Digital patterns (.atp) | The pattern-start calls in VBT source, resolved to the pattern files they name. | Re-cyclize a pattern and the map names every test that starts it. |
| IG-XL sheets | Mapped alongside the code; the TestInst sheet drives active-function coverage below. | The program's structure, not just its code. |
| C / C++, Python, TypeScript, Go, Rust, C# | Import and include statements per language. | Mixed-language test benches map in the same table. |
The pattern join is the one worth stopping on. In an IG-XL program the link
between a test and its pattern lives inside the code that starts the pattern —
invisible to any conventional import scanner. The Code Map resolves those
pattern-start calls to the repo's .atp files, so the question
"if I re-cyclize this pattern, which tests re-run?" has a
deterministic answer.
Active-function coverage
The TestInst sheet names the VBT procedure each test instance calls — those are the procedures that actually run on the tester. Coverage reconciles that list against the procedures the repo actually implements — mechanically: same inputs, same answer. The result is the number an IG-XL engineer thinks in: of the active procedures, how many have an implementation?
Anything active but unimplemented is listed by name. When no TestInst sheet parses, the metric renders as an em dash with the reason, not a number.
The graph view
The same dependencies render as a graph: files that import nothing local on the left, top-level consumers on the right — a deterministic layout that stays smooth on a ~200-node repo. The graph and the table describe the same map, so they cannot disagree. Isolated nodes — files with no edges in either direction — hide behind a toggle to keep the view dependency-signal only.
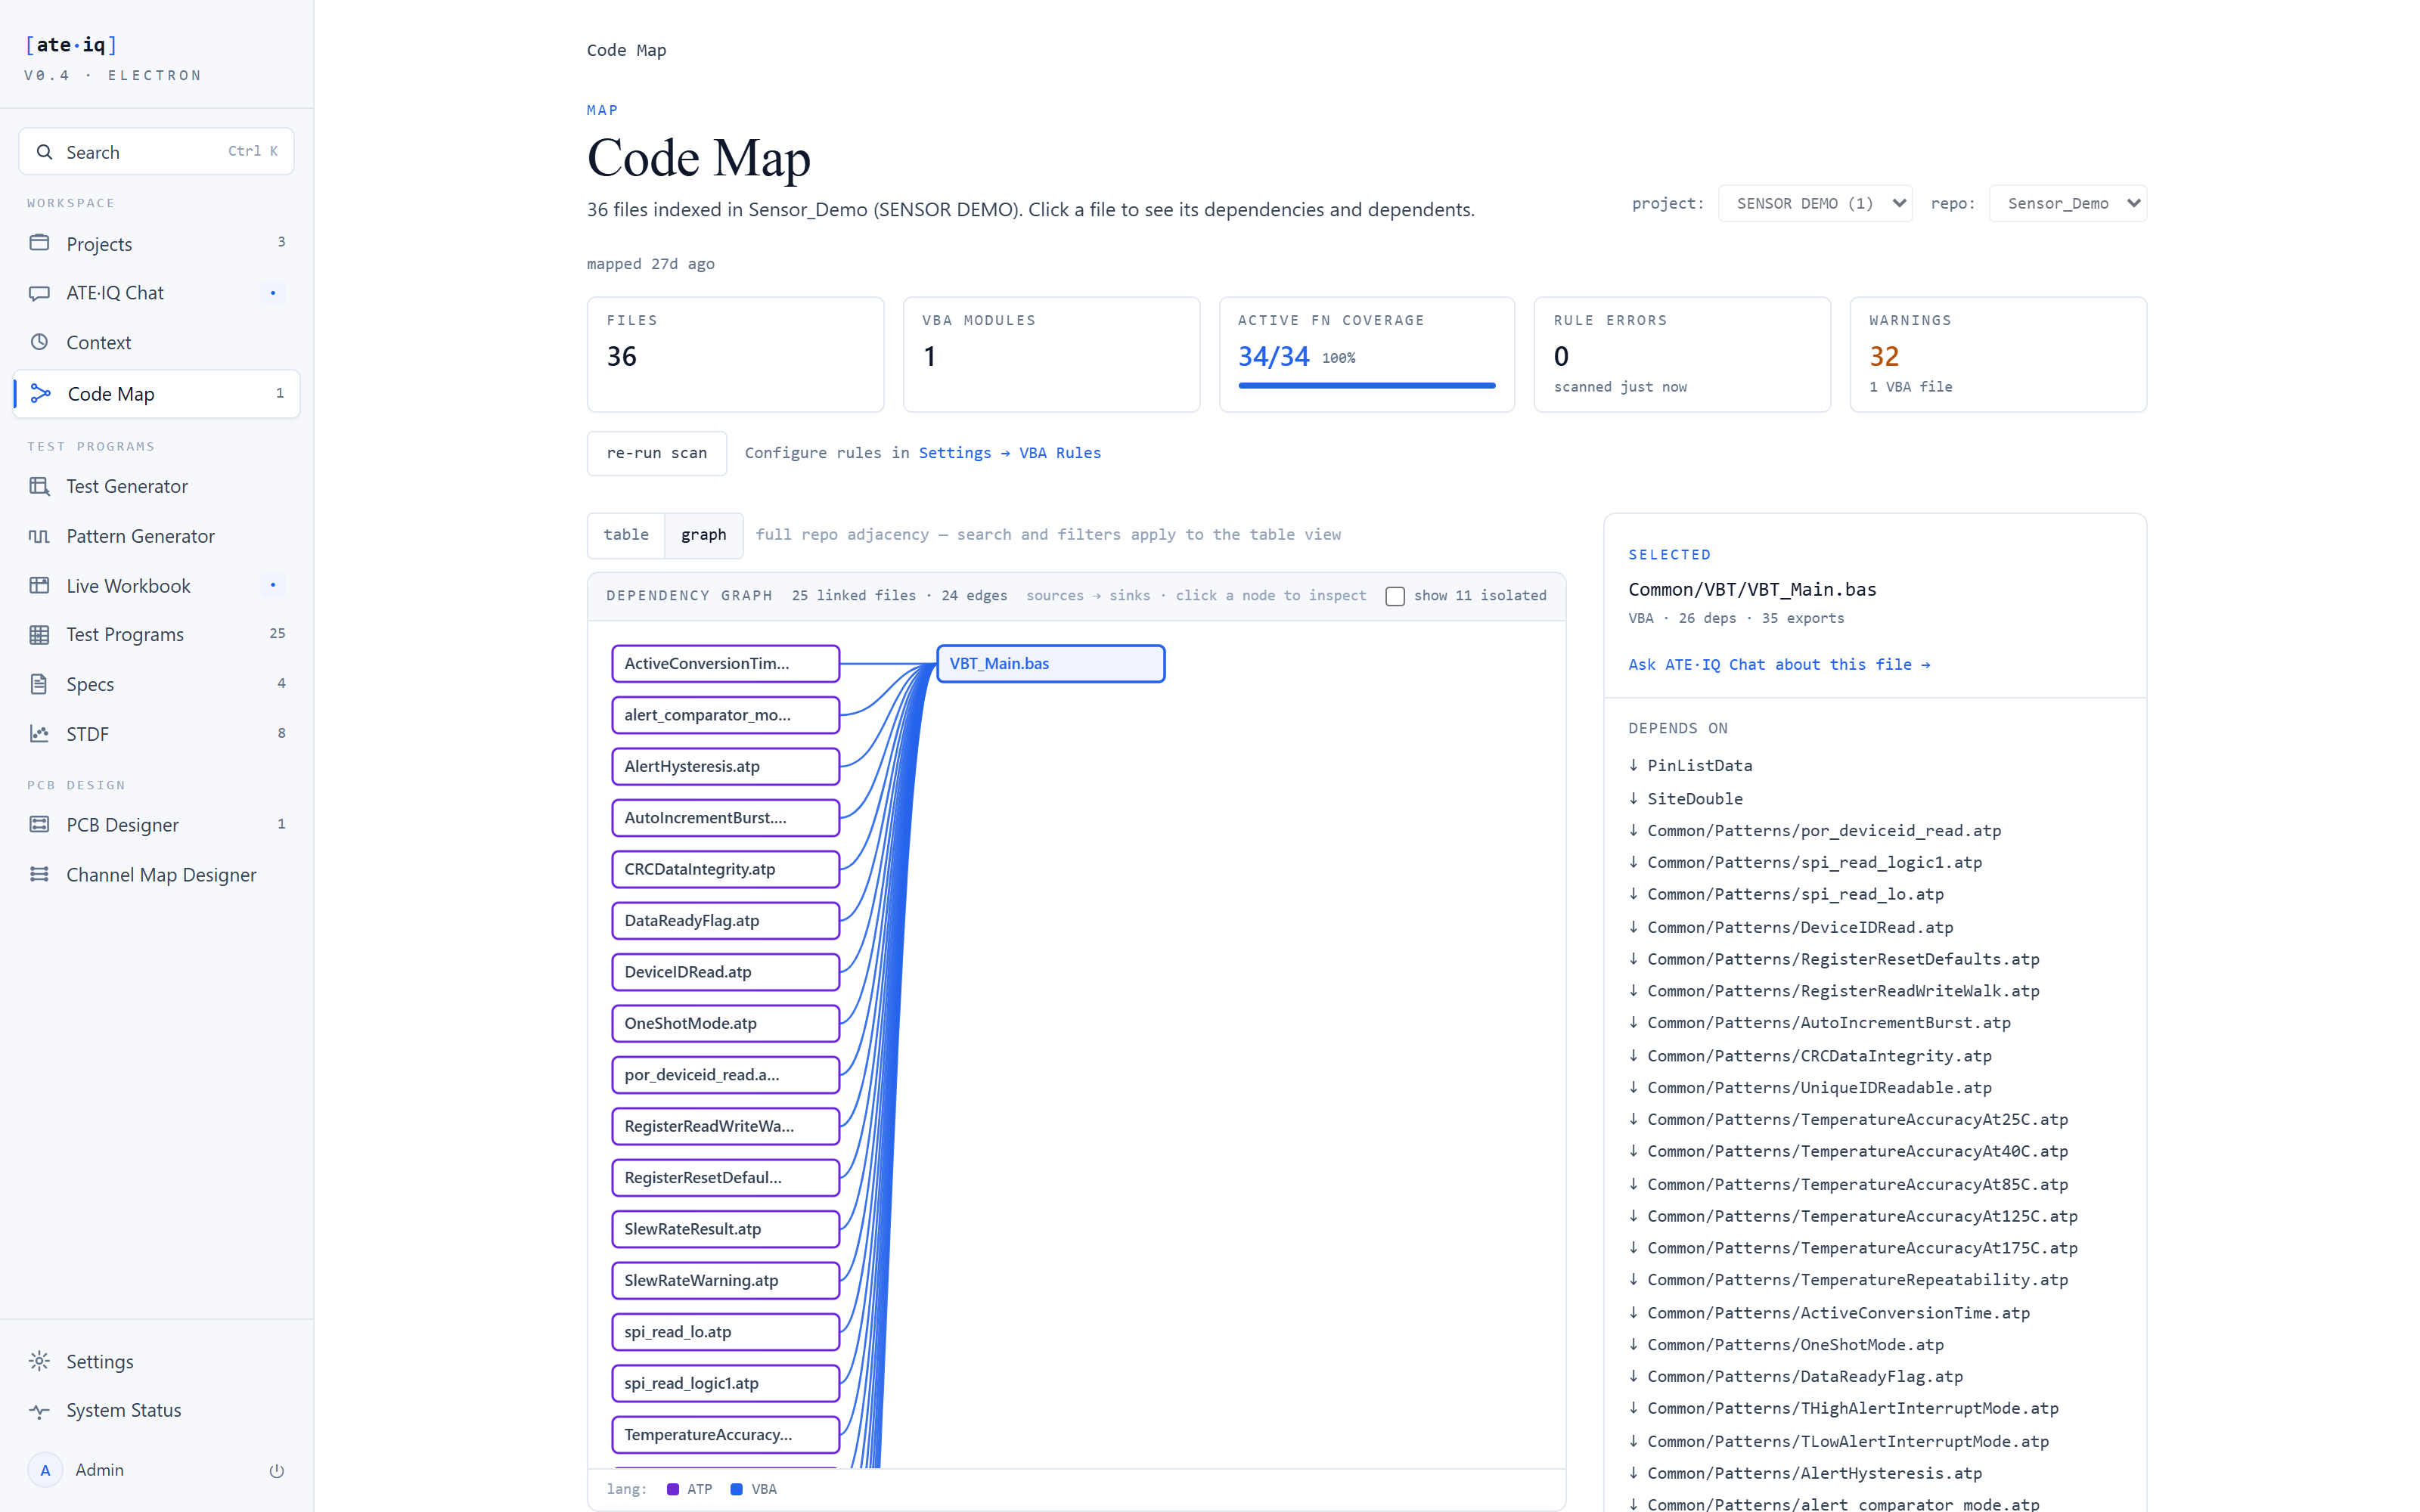
.atp pattern nodes fanning into VBT_Main.bas through their pattern-start calls. Node click opens the same selected-file panel.From repo to map
Every repo sync rebuilds the map — language, imports, exports — from what is actually in the repo: same inputs, same answer. A truncated read is labelled truncated, never passed off as complete. Quality findings overlay the same table, and freshness is always stated — a map that is re-indexing, failed or stale says so instead of presenting itself as current.
Proven end to end
The generated demonstration program maps to 36 files: one VBT module with 35 exported procedures, the IG-XL sheets, and the 24 pattern files the generator emitted. Active-function coverage reads 34/34, the graph view shows the pattern fan-in at a glance, and the quality overlay reports 0 errors and 32 warnings on the module — each with file, line, rule id and severity.